
Reading funnel step statistics
How to read views, opt-ins, sales, and conversion rate for each step in a funnel, and how to spot which step is losing you visitors.
A funnel is only as strong as its weakest step. The overview dashboard tells you how a funnel is doing overall, but to find out why, you need the per-step Stats tab — the page-by-page breakdown that shows exactly where visitors are dropping off, opting in, or buying. This article walks through how to read it and how to diagnose a weak step.
Where to find per-step stats
- Go to Sites, then Funnels.
- Find the funnel you want to review, click the three-dot menu on it, and select Edit.
- Inside the funnel editor, click the Stats tab.
- Use the date range dropdown at the top to set the period you want to analyze (last 7 days, last 30 days, or a custom range).
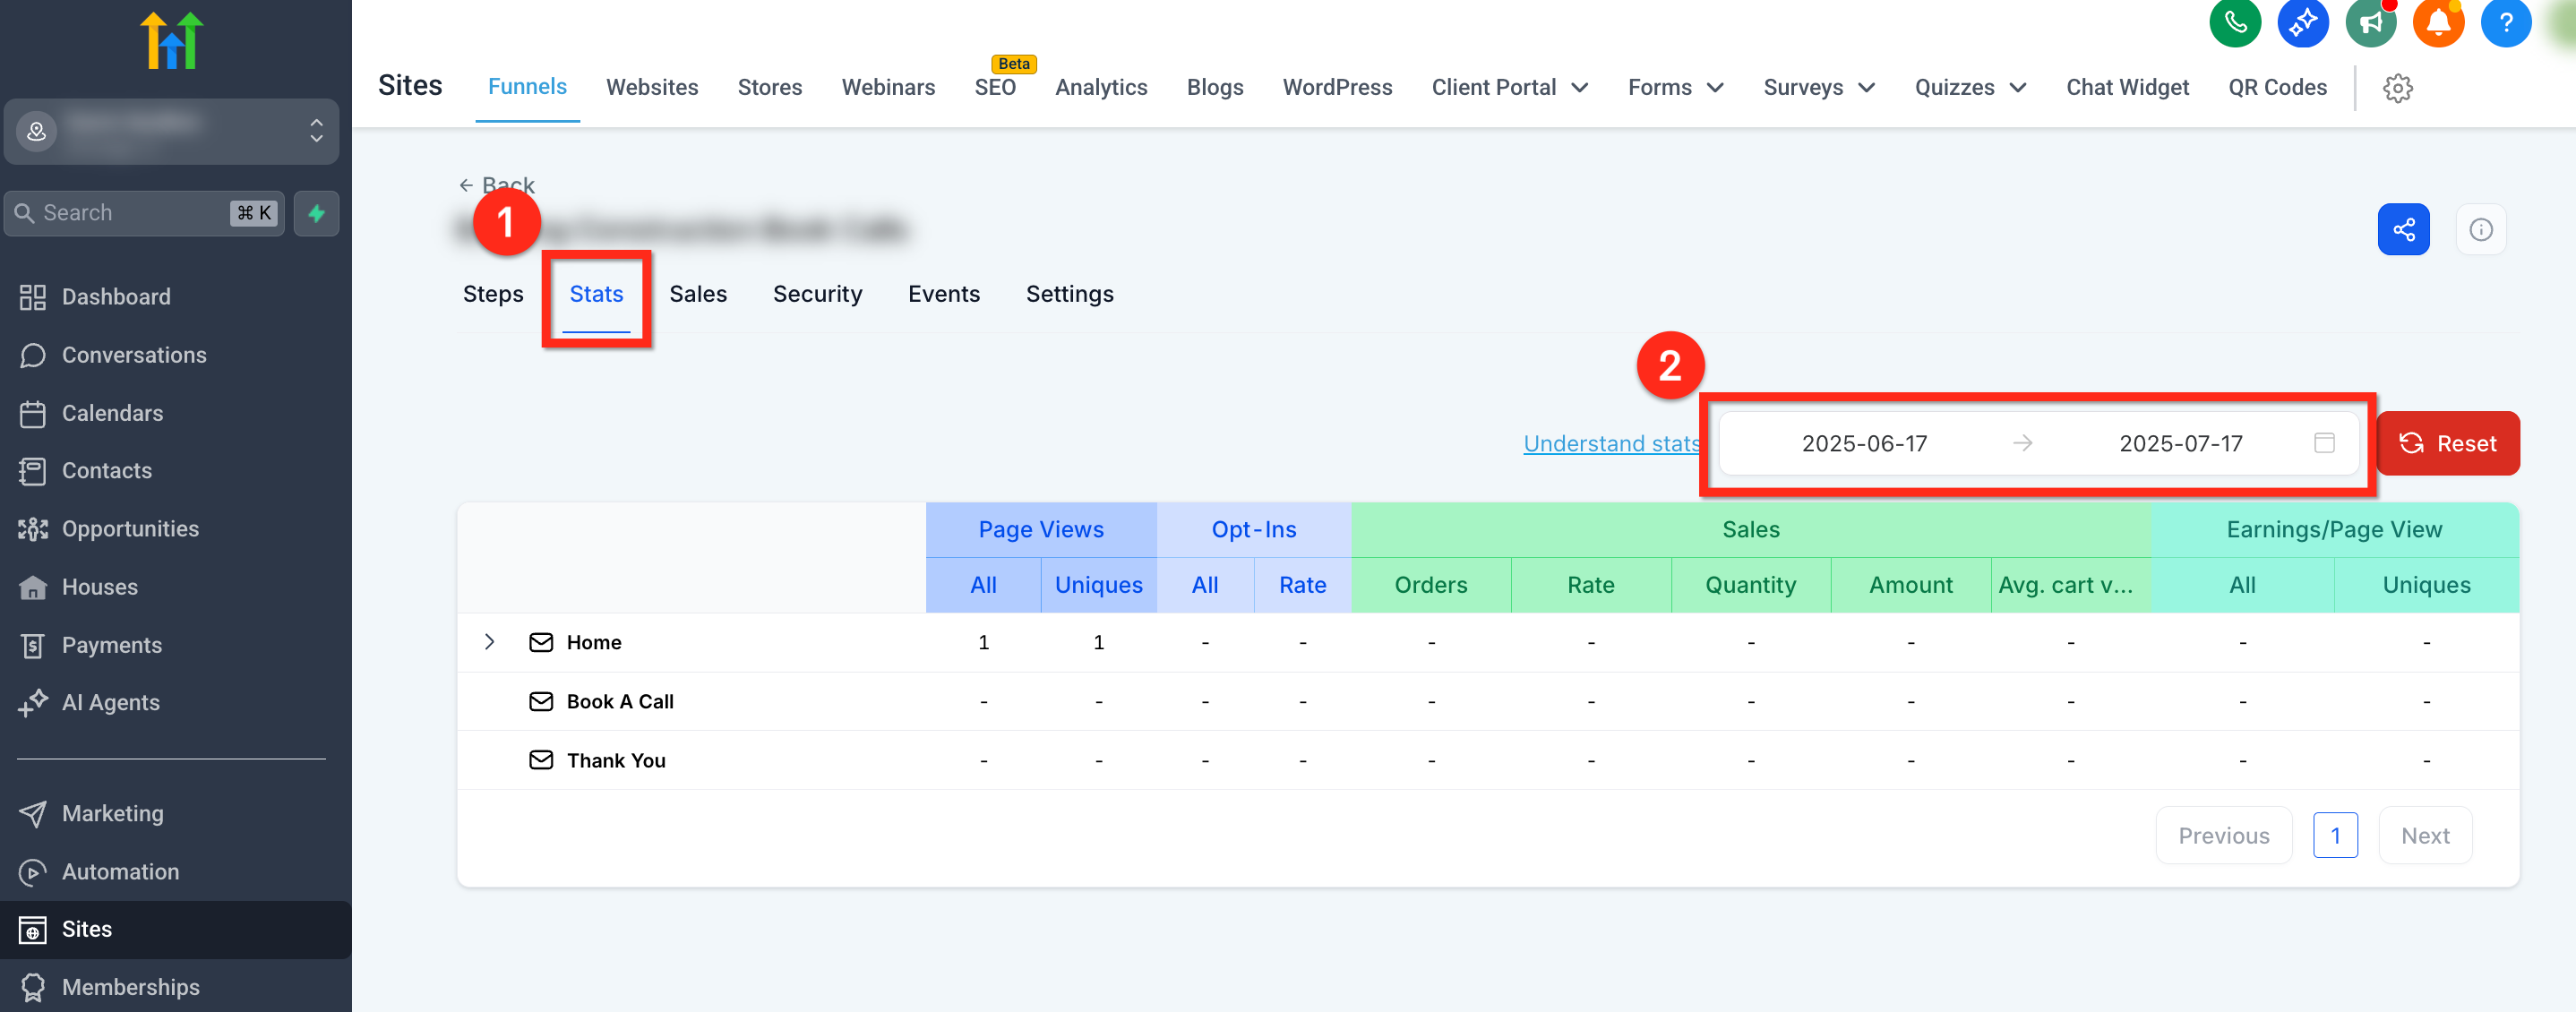
Each step in your funnel gets its own row of metrics, so you can scan down the list and see exactly where performance changes from one page to the next.
What each column means
| Column | Definition |
|---|---|
| Page Views — All | Total page loads for that step, including repeat visits |
| Page Views — Unique | Distinct visitors who reached that step |
| Opt-ins | Count of visitors who submitted a form/survey, booked an appointment, or purchased, on that step |
| Opt-in Rate | Opt-ins ÷ unique page views, shown as a percentage |
| Sales — Orders | Number of purchase transactions placed on that step |
| Sales — Rate | Purchases ÷ unique page views |
| Sales — Amount | Total revenue generated on that step |
| Average Cart Value | Total sales amount ÷ total orders |
| Earnings/Pageview | Sales amount ÷ page views (shown for both all views and unique views) |
If a step sells more than one product (a main offer plus an order bump, for example), you can also see stats broken out per product — how many times the bump was purchased, and the bump's rate relative to total orders on that step.
Tip: "Opt-in Rate" and "Sales Rate" both use unique page views as the denominator, not total views. That matters if a step has a lot of repeat visits (someone bouncing back and forth) — the rate reflects real people, not raw page loads.
Reading drop-off between steps
The platform doesn't label a "drop-off" metric explicitly, but you calculate it the same way any funnel analyst would: compare unique visitors on one step to unique visitors on the next step.
Drop-off rate = 1 − (unique views on Step B ÷ unique views on Step A)
For example, if your opt-in page had 1,000 unique visitors and only 400 made it to the order page, that's a 60% drop-off between those two steps — a strong signal that something on the opt-in page (or the transition to the next step) is losing people.
A simple way to scan for problems
Read down the unique-views column, step by step, top to bottom. Every funnel loses some visitors at every step — that's normal. What you're looking for is one step where the drop is dramatically bigger than the others. Most funnels have one or two "leaky" steps responsible for the majority of total drop-off, rather than an even bleed across every page.
Diagnosing a weak step
Once you've found the step with the biggest drop-off or the lowest opt-in/sales rate, work through these questions:
- Is the traffic even reaching the step correctly? If page views are much lower than expected compared to the step before it, check that the "next step" button or redirect on the prior page actually points where it should.
- Is the offer or ask too big for this point in the funnel? A high-friction step (a long form, a request for payment info) right after a low-commitment step (a simple landing page) often causes a sharp drop. Consider softening the ask or adding a step in between.
- Is the page itself broken or slow? Check the page on both desktop and mobile. A page that looks fine on your monitor can be broken on a phone.
- Is this step's opt-in rate low but sales rate on the next step also low? That combination usually points to a mismatch between what the opt-in page promised and what the sales page delivers — visitors convert but then bail once they see the actual offer.
- Compare against traffic source, if you can. A step that converts fine for one channel (say, email) but poorly for another (say, paid ads) may indicate the messaging doesn't match what that audience expected. (The attribution basics article covers how to trace a contact back to their source.)
Warning: Don't judge a step's performance on a handful of visitors. A 0% opt-in rate on 4 visitors tells you nothing. Give a step enough traffic (generally at least a few dozen unique visitors) before concluding it's underperforming.
What done looks like
You should be able to open a funnel's Stats tab, identify the single step with the worst unique-visitor drop-off or lowest opt-in rate, and state a specific hypothesis for why (offer mismatch, broken step, too much friction) rather than a vague "it's just not converting."
Related articles
Frequently asked questions
What's a "good" conversion rate for a funnel step?
It depends heavily on the offer, traffic source, and industry — there's no universal number. Sales funnel conversion rates across a wide range of businesses commonly average around 2–3%, with strong performers reaching 5% or higher. Treat your own funnel's historical performance as the real benchmark, and watch for a step that's meaningfully worse than its neighbors rather than comparing to an outside number.
Why is my Opt-in Rate over 100%?
It shouldn't be, but if a single visitor opts in more than once during the tracked window (submits a form, then later books an appointment on the same step), it's possible for opt-in count to exceed unique page views in unusual cases. If you see this consistently, double-check that the step doesn't have duplicate opt-in actions counting the same visitor twice.
Do repeat visits inflate my stats?
Only the "All" page views figure includes repeat visits. Opt-in Rate and Sales Rate are both calculated against unique page views specifically to avoid that kind of inflation.