
Funnel and website analytics overview
Where to find performance data for your funnels and websites, what each metric means, and how to read the dashboard at a glance.
Every funnel and website you publish on the platform is already tracking visitors, opt-ins, and sales in the background. You don't need to install anything to see basic performance — you just need to know where to look and what the numbers mean. This article is the map: it shows you where analytics live, what each metric measures, and how to move from a high-level view to a single page's performance.
Where to find it
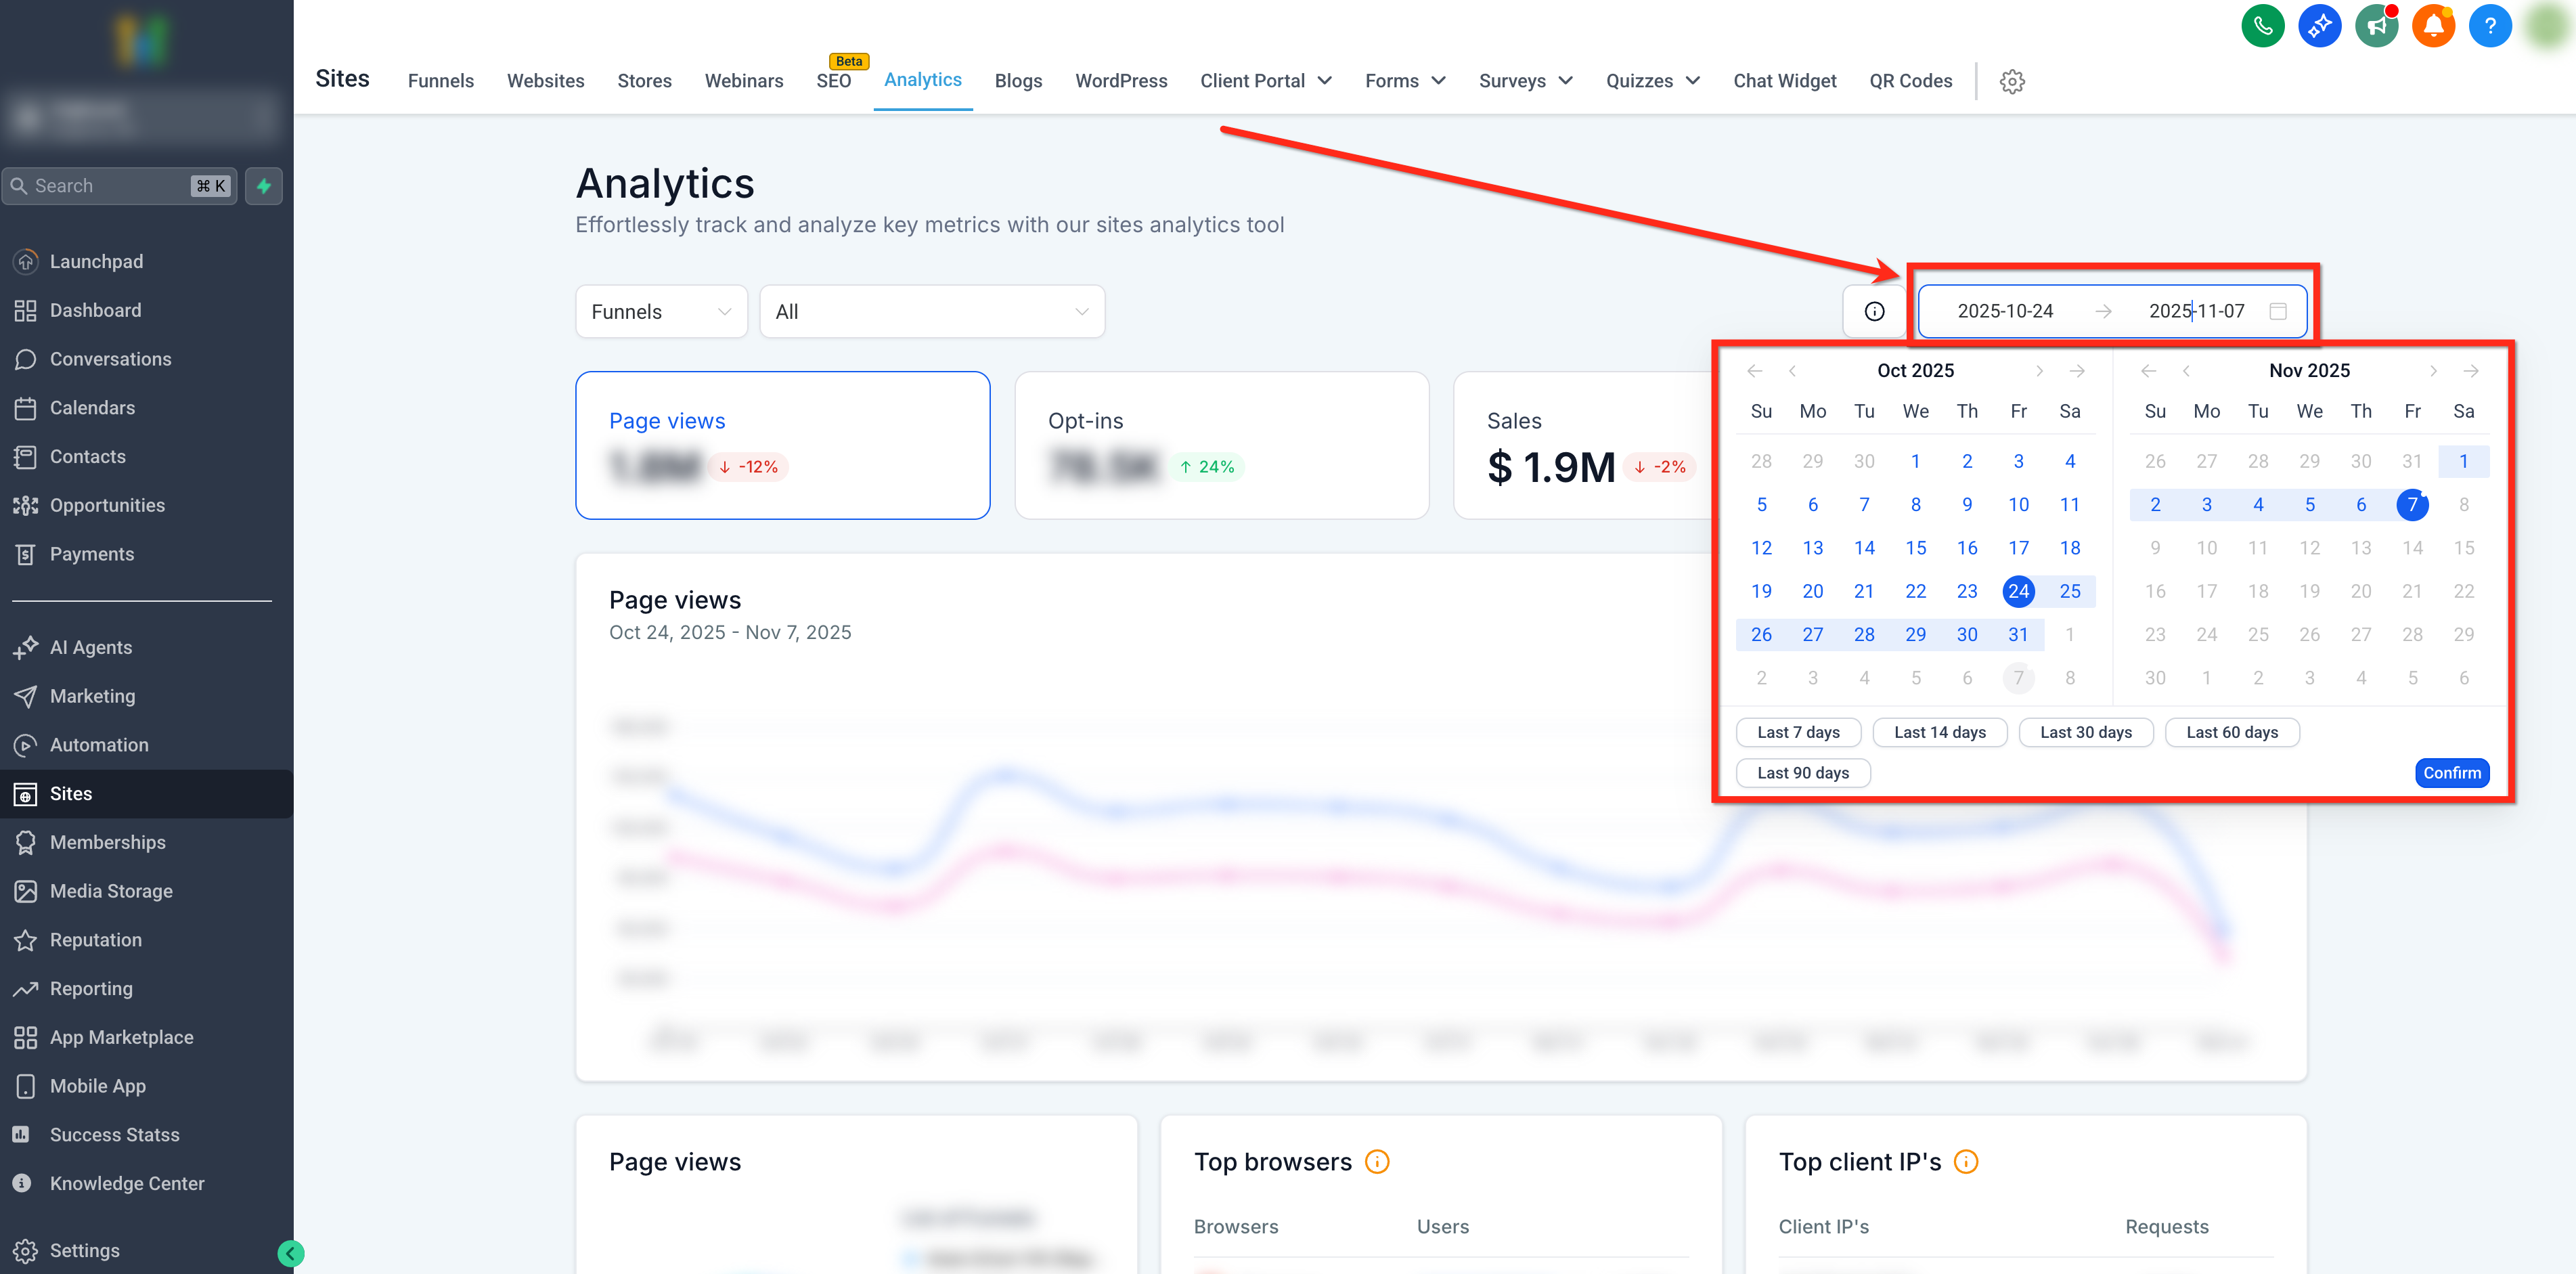
Your funnel and website analytics live in one place: go to Sites, then open the Analytics tab in the top navigation. This is a dashboard-style view, separate from the page-by-page "Stats" tab you'll find when editing an individual funnel (more on that below).
Note: Analytics data only starts collecting once a funnel or website is published and receiving real traffic. Draft pages and preview links won't generate stats.
The two views: dashboard vs. per-page stats
The platform gives you two complementary ways to look at performance:
- Sites > Analytics — a cross-asset dashboard. Good for spotting trends, comparing date ranges, and seeing which asset (a specific funnel, website, blog, etc.) is pulling the most traffic.
- Stats tab inside a funnel or website editor — a page-by-page breakdown for one specific asset, showing views, opt-ins, and sales at each step. This is where you diagnose a weak page (covered in the next article).
Use the dashboard for the big picture and the per-asset Stats tab when you need to fix something specific.
Filtering the dashboard
The Analytics dashboard has two filter layers:
- Asset type (required): choose Funnels, Websites, Blogs, Webinars, Forms, Surveys, QR Codes, or External Tracking. Only one asset type is shown at a time — you can't blend funnel and website traffic into one chart.
- Asset and date range (optional): narrow down to one specific funnel or website, or leave it on "All" to see aggregated numbers across everything of that type. The date range defaults to the last 14 days and automatically compares against the prior equal period, so you can see whether things are trending up or down at a glance.
Tip: When you're checking in weekly, leave the default 14-day window and just glance at the comparison arrows next to each KPI. They tell you the direction before you dig into the chart.
What each KPI card means
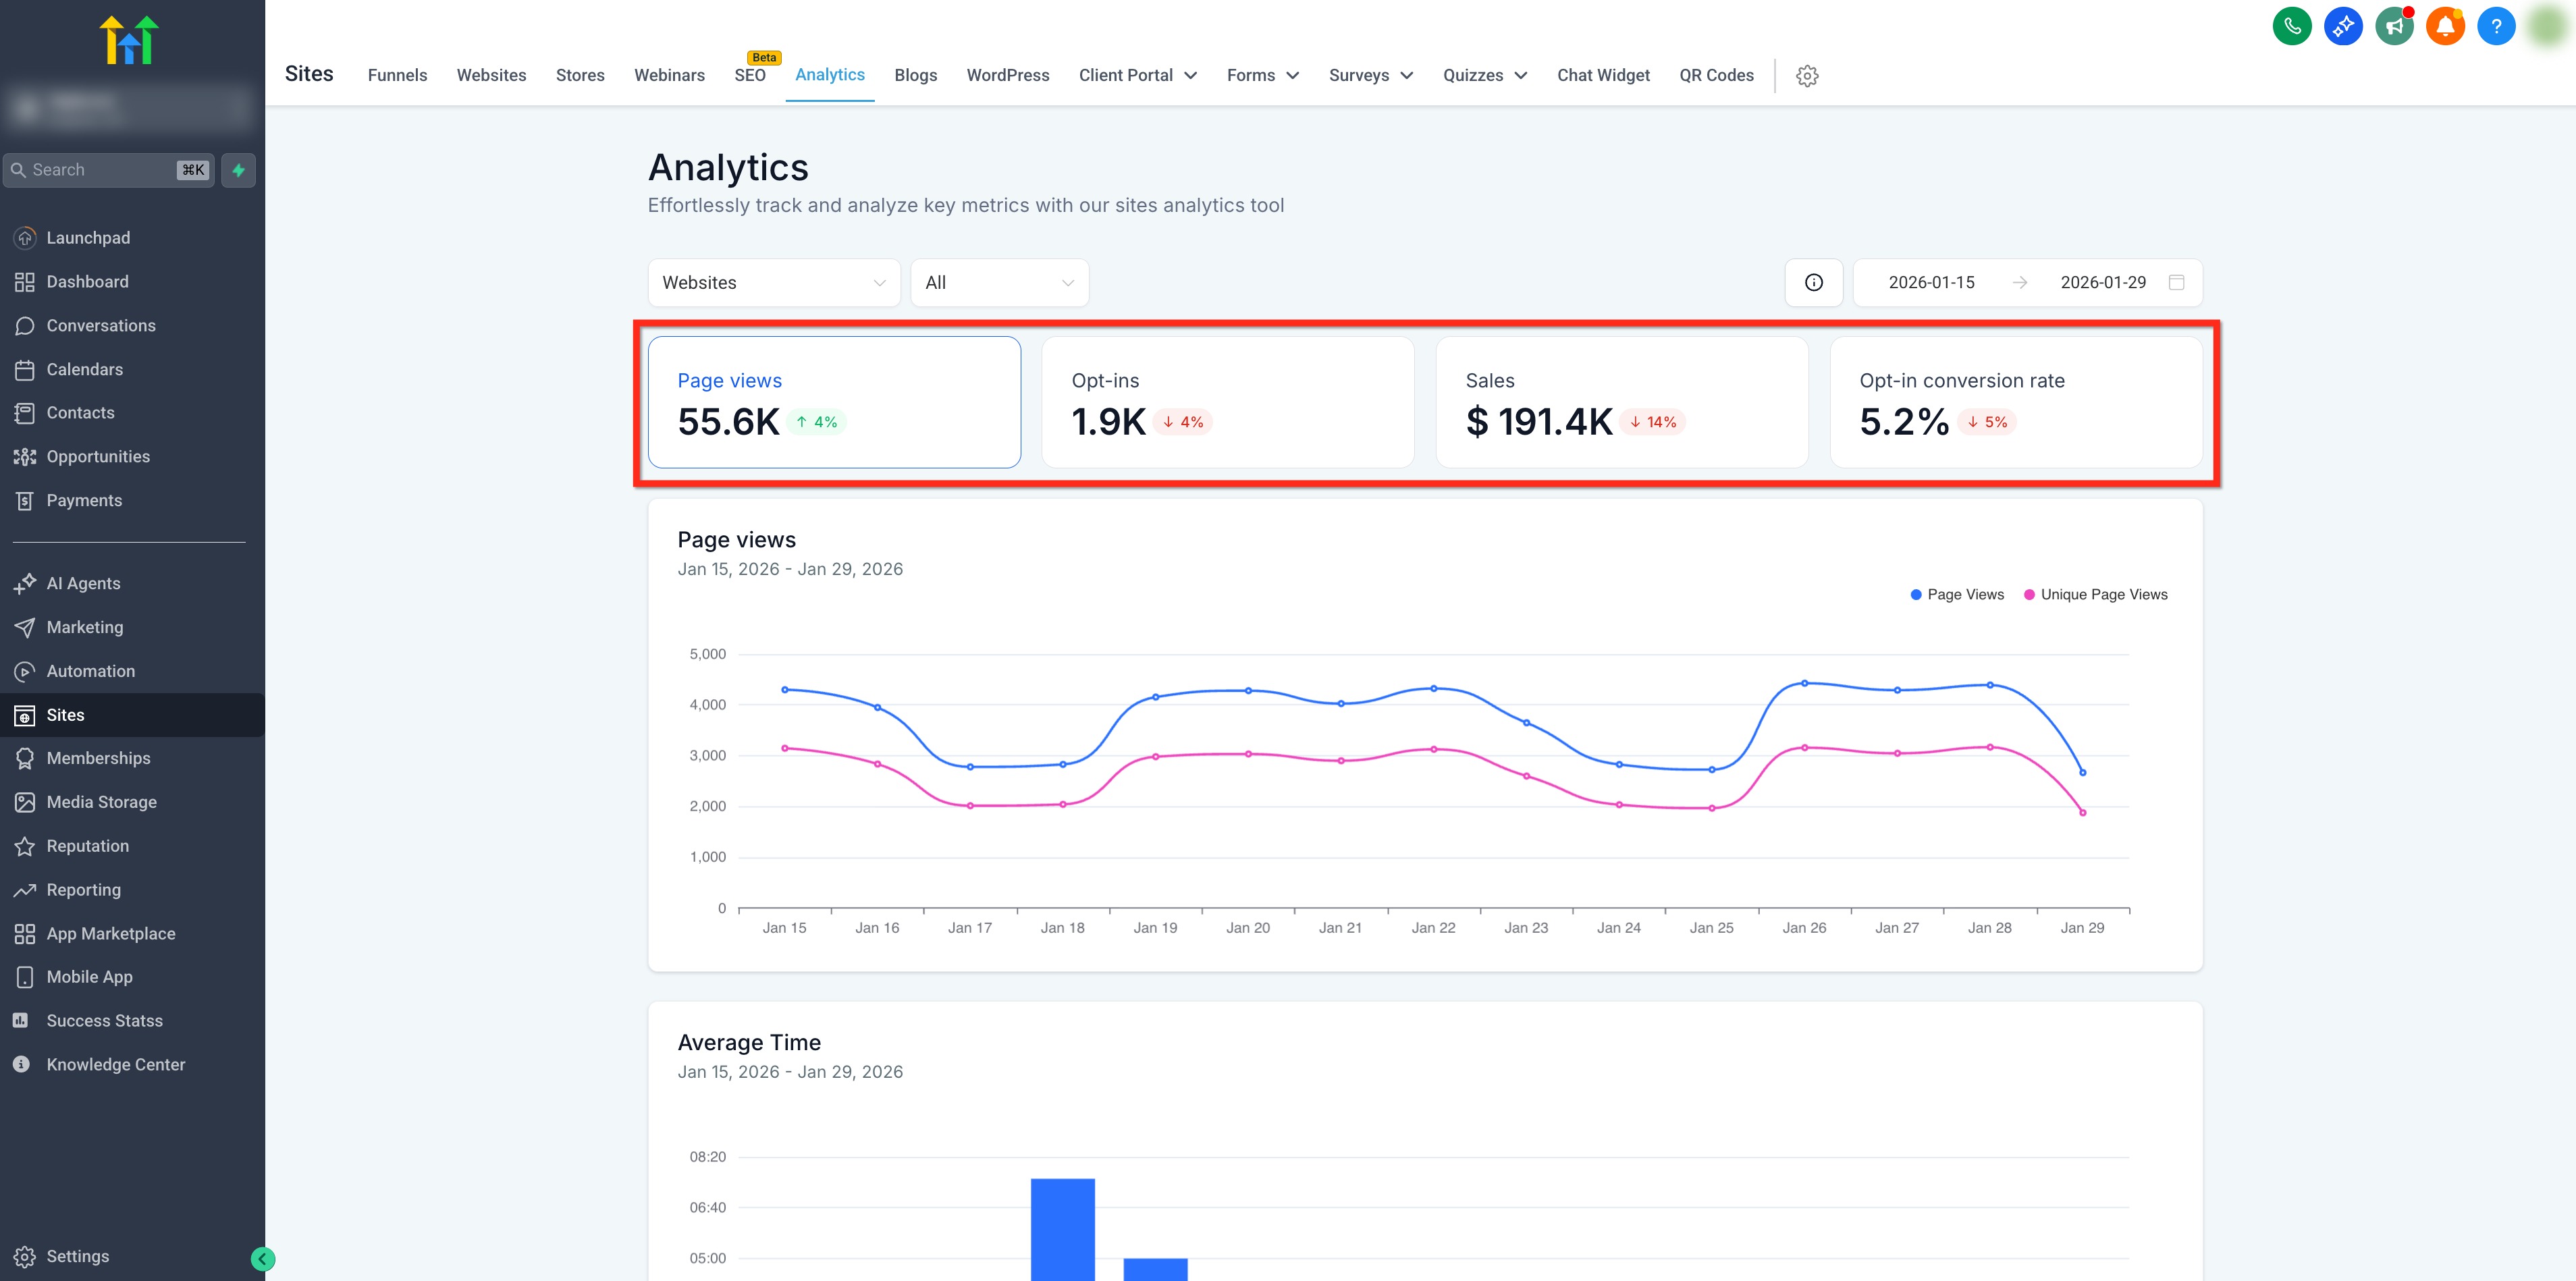
The dashboard shows a row of KPI cards. Clicking a card acts like a tab — it updates the chart and breakdown below to focus on that metric.
| Metric | What it measures |
|---|---|
| Page Views (All) | Every page load, including repeat visits from the same person |
| Page Views (Unique) | Distinct visitors who loaded the page at least once |
| Opt-ins | Visitors who converted — submitted a form or survey, booked an appointment, or purchased a product |
| Opt-in Conversion Rate | Opt-ins divided by unique page views |
| Sales | Revenue generated from purchases made on that asset |
| Time on Page | How long visitors typically stay before leaving or converting |
Under the hood, "Opt-in" is intentionally broad — it counts any conversion action, not just form fills. If a step has a form, a booking calendar, and an order form all on the same page, an opt-in on any of them counts toward that step's total.
Drilling into a specific step
From the Page Views chart, click into an individual funnel step to see step-level performance — views, opt-ins, and sales for just that page, without needing to leave the dashboard. This is useful for a quick check, but for a full side-by-side comparison of every step in a funnel, the per-funnel Stats tab (covered in the next article) is the better tool.
Special cases
A couple of asset types behave a little differently in the dashboard:
- QR Codes show simplified metrics only — there's no KPI-card toggle, just scan counts over time.
- External Tracking requires a tracking script to be correctly installed on the destination site before any data will appear. If you've added an External Tracking asset and see zero activity, double-check the script installation first — this is covered later in the "Add Google Analytics, Tag Manager, and ad pixels" article.
What done looks like
You should be able to open Sites > Analytics, pick "Funnels," see a KPI row with real numbers (even if small), and explain in one sentence what each number means without guessing. If a specific funnel looks weak, you know your next stop is that funnel's own Stats tab.
Related articles
- Reading funnel step statistics
- Split testing your pages
- Add Google Analytics, Tag Manager, and ad pixels to your pages
- Attribution and UTM basics
Frequently asked questions
Why don't I see any data yet?
Analytics only populate once a funnel or website is published and receiving live traffic. Preview links and unpublished drafts don't count. Give it a few minutes after your first real visitor — data isn't always instant.
Can I compare a funnel to a website in the same chart?
No. The dashboard requires you to pick one asset type at a time (Funnels, Websites, etc.), so a direct side-by-side isn't built in. You can switch the asset-type filter back and forth to eyeball two views, but the numbers won't sit in one chart together.
Does "Opt-ins" include people who abandoned a form halfway through?
No. Opt-ins only count completed actions — a submitted form, a booked appointment, or a completed purchase. Partial form fills aren't counted as opt-ins.